Navigating through AreaPro’s metrics is like having a gateway to the heartbeat of the real estate market. Each of these metrics serves as a powerful tool in your real estate arsenal, enabling you to analyze the market with a data-driven approach. By mastering these metrics, you can provide better guidance to your clients, price your listings effectively, and devise strategies that resonate with the current market conditions. Here, we’ll explore each metric in detail to provide a clearer understanding of what they signify and how they can be utilized.
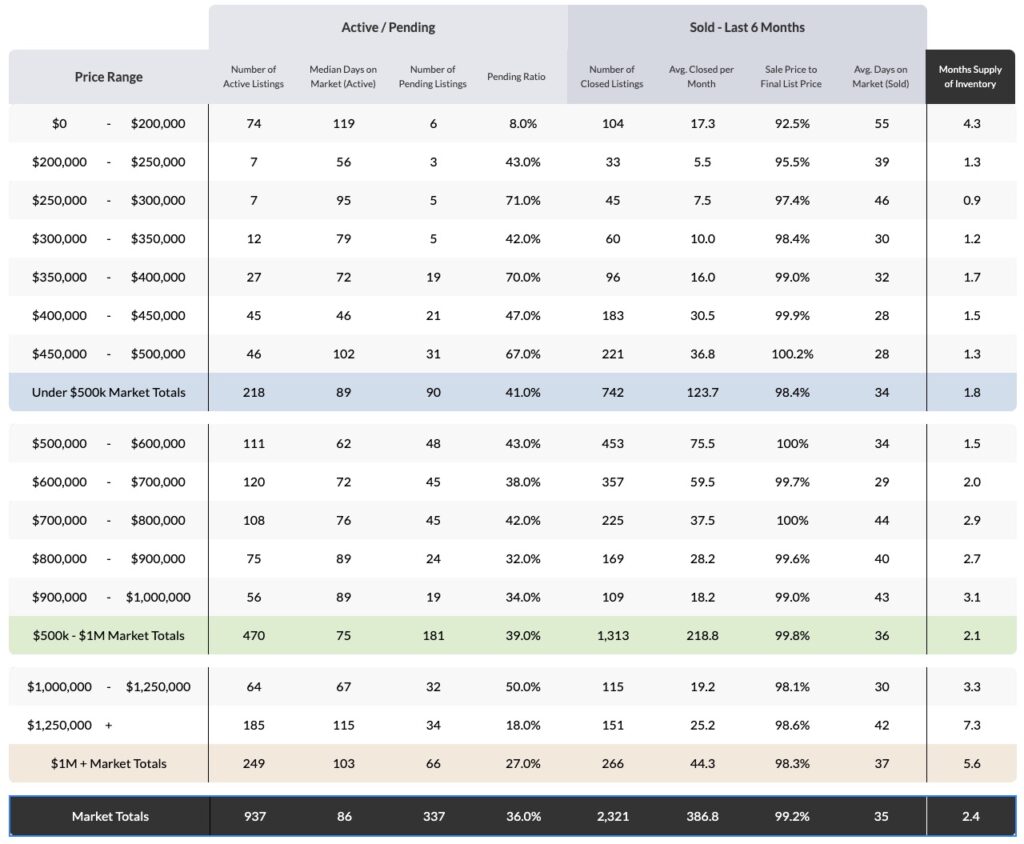
Months Supply of Inventory #
The Months Supply of Inventory is a crucial metric that estimates the duration it would take to sell all the existing listings in your defined area at the current sales pace. This metric provides a snapshot of the balance between supply (listings) and demand (sales pace).
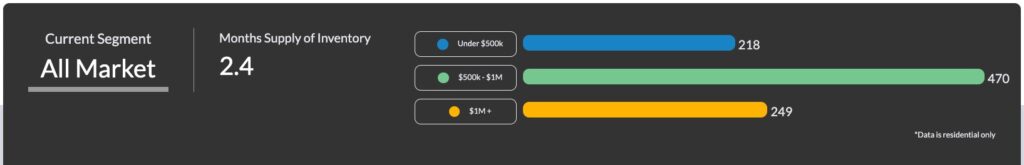
2.4 months supply of inventory in a certain county indicates a seller’s market, suggesting that there’s higher demand and potentially a favorable market for sellers due to limited inventory. In contrast, a 6 months’ supply could signify a balanced market, where neither buyers nor sellers have a significant advantage. This metric becomes exceptionally insightful when analyzed in conjunction with specific price ranges. For example, while the overall market might indicate a seller’s market, diving into higher price ranges, like homes priced between $700,000 to $800,000, might reveal a balanced or even a buyer’s market. This nuanced insight is invaluable when advising clients on pricing strategies or purchase offers. By understanding the Month’s Supply of Inventory, you can better strategize and provide informed advice to your clients. Whether it’s advising sellers on when to list their properties or helping buyers understand the competition, this metric is pivotal in navigating the market dynamics effectively.
Active / Pendings #
The Active / Pendings section in AreaPro provides insight into the current market dynamics by displaying the number of active listings and pending sales in your designated area.

Active Listings #
Active Listings are the properties currently available for sale in your defined area. It is a snapshot of the supply side of the market equation. Monitoring active listings over time can reveal trends such as increasing or decreasing inventory levels. For instance, a decreasing trend in active listings might signify a shrinking supply which could potentially drive prices up if demand remains constant or increases.
Pending Sales #
Pending Sales refer to the number of properties where a sale agreement has been reached but the sale has not yet closed. It’s like a pulse check on immediate market demand. A rise in pending sales could signal growing buyer interest and a potential uptick in market activity, which could be useful when advising sellers on listing their properties or buyers on making competitive offers.
Pending Ratio #
The Pending Ratio is calculated by dividing the number of pending sales by the number of active listings, often expressed as a percentage. It is a quick gauge of market momentum. A higher pending ratio, say 40%, might indicate a seller’s market where properties are moving quickly from active to pending status. Conversely, a lower ratio could suggest a buyer’s market, providing an opportunity for buyers to have a wider choice and possibly more negotiation power.
Average Days on Market #
The Average Days on Market (DOM) metric tells you the average duration a property stays listed before moving to a pending status. It’s a useful indicator of market velocity. For example, a lower DOM, like 20 days, could suggest properties are selling quickly, advising sellers on the potential for a swift sale and buyers on the need for prompt action. On the other hand, a higher DOM could indicate a slower pace, which might impact pricing strategies and negotiations. Utilizing AreaPro to monitor these metrics, you can get a firm grasp of both the supply and demand dynamics in your defined market area. This data empowers you to offer informed advice to your clients, whether they are looking to buy or sell, enhancing your service quality and potentially your success rate in closing deals.
Sold Data #
Gaining insights into recently sold properties is crucial for understanding the current market conditions and setting realistic expectations for both buyers and sellers. The Sold Data section in AreaPro provides a concise summary of key metrics related to closed transactions. These metrics include the total number of closings, the average number closed per month, the percentage of sale price, and the average days on market. Here’s a detailed breakdown of these metrics:

Closings #
This refers to the total number of properties that have been sold or closed in your defined area over a specified period. Observing the total closings can provide a broader understanding of the overall market activity and help identify trends. For instance, an increase in closings might indicate a rising market momentum.
Average Closed Per Month #
This metric represents the average number of properties sold per month, giving a more granular view of the market’s pacing. Analyzing the average closed per month can help in identifying seasonal trends or the impact of external factors on market activity.
Percent of Sale Price #
This metric unveils the average percentage of the asking price that the closed properties achieved. For example, a percent of sale price of 98% means on average, properties sold for 98% of their asking price. Understanding this percentage can be invaluable when advising sellers on pricing strategies or buyers on making competitive offers.
Average Days on Market (DOM) #
The Average DOM metric for closed properties reveals the typical duration a property stayed listed before being sold. A shorter DOM might indicate a seller’s market with high demand, while a longer DOM could signify a buyer’s market, providing valuable insights for strategy formulation. By delving into the Sold Data metrics via AreaPro, you can obtain a comprehensive understanding of the recent market performance, which is instrumental in formulating informed strategies and providing sound advice to your clients. Whether it’s setting a competitive listing price or crafting a compelling offer, the Sold Data section is an indispensable resource for real estate professionals.
Average Prices #
The Average Prices section in AreaPro provides a detailed analysis of the pricing trends across active, pending, and sold listings. Understanding these price metrics helps in comprehending the market dynamics and advising clients accurately. Here’s an exploration of these metrics:

Active Average Price #
This metric represents the average listing price of all active listings in your defined area. It gives a glimpse into the current market expectations from sellers and can be used to guide pricing strategies for new listings.
Pending Average Price #
This indicates the average price of all properties that are under contract but not yet closed. Tracking this metric over time can show if the market is heating up or cooling down, based on whether the pending average price is trending upwards or downwards.
Sold Average Price #
This metric reflects the average sale price of all properties that have closed in a specified period. It provides a realistic picture of what buyers are willing to pay in the current market, which is valuable information for both buyers and sellers.
Pending to Active Price Ratio #
This ratio is calculated by dividing the pending average price by the active average price. A ratio greater than 1 could indicate a market where buyers are competing for fewer available homes, possibly driving up the contract prices.
Sold to Pending Price Ratio #
This ratio is derived by dividing the sold average price by the pending average price.
A ratio close to 1 might indicate a stable market where the agreed contract prices are close to the final sale prices.
These metrics available through AreaPro offer a comprehensive understanding of the prevailing pricing trends. Analyzing these trends enables real estate professionals to set realistic pricing expectations with clients, devise effective marketing strategies for listings, and provide insightful advice to buyers on making competitive offers. Each of these ratios and averages play a vital role in comprehending the pricing dynamics of the market, thereby assisting in making well-informed decisions.
Dynamic Price Point Filtering #
AreaPro provides tools to delve into specific price points, offering a clear picture of market conditions within different price ranges.

Range Selector #
Select different price ranges (e.g., $500,000 to $1,000,000), and watch as AreaPro dynamically updates the metrics for that segment, giving you a tailored insight.
Focused Analysis #
Narrow down the range further (e.g., $700,000 to $800,000) for a detailed view. This feature is invaluable when working with clients with specific price points in mind, helping identify market segments leaning towards a buyer’s or seller’s market.
Price Point Breakdown #
At the bottom of the REMO you will find a detailed price point breakdown, with all of these metric at-a-glance.